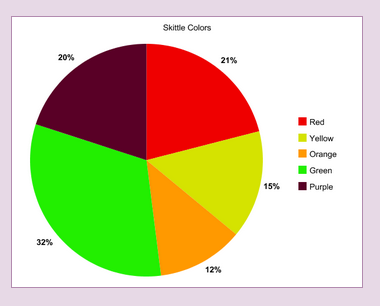
Today in math we learned about sampling data and pie charts. We sampled a bag of Skittles on our own with 10 and a combination of 100. We made 2 pie charts one using the data we got on our own and one using to class data. The first one is the one from my data. The second one is from the class data. A larger sample would make a more accurate data set because it has different numbers from different people and it would get us closer to the real amount or population. 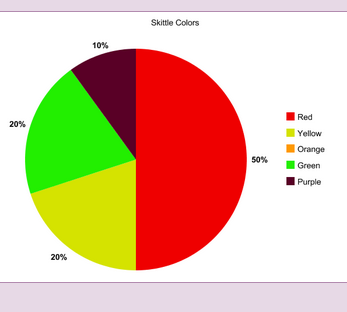
0 Comments
Leave a Reply. | AuthorI'm a fifth grader in Ankeny i love to play the guitar. ArchivesDecember 2014 Categories |
 RSS Feed